Understand the steps with six points before fitting the larger customer table.
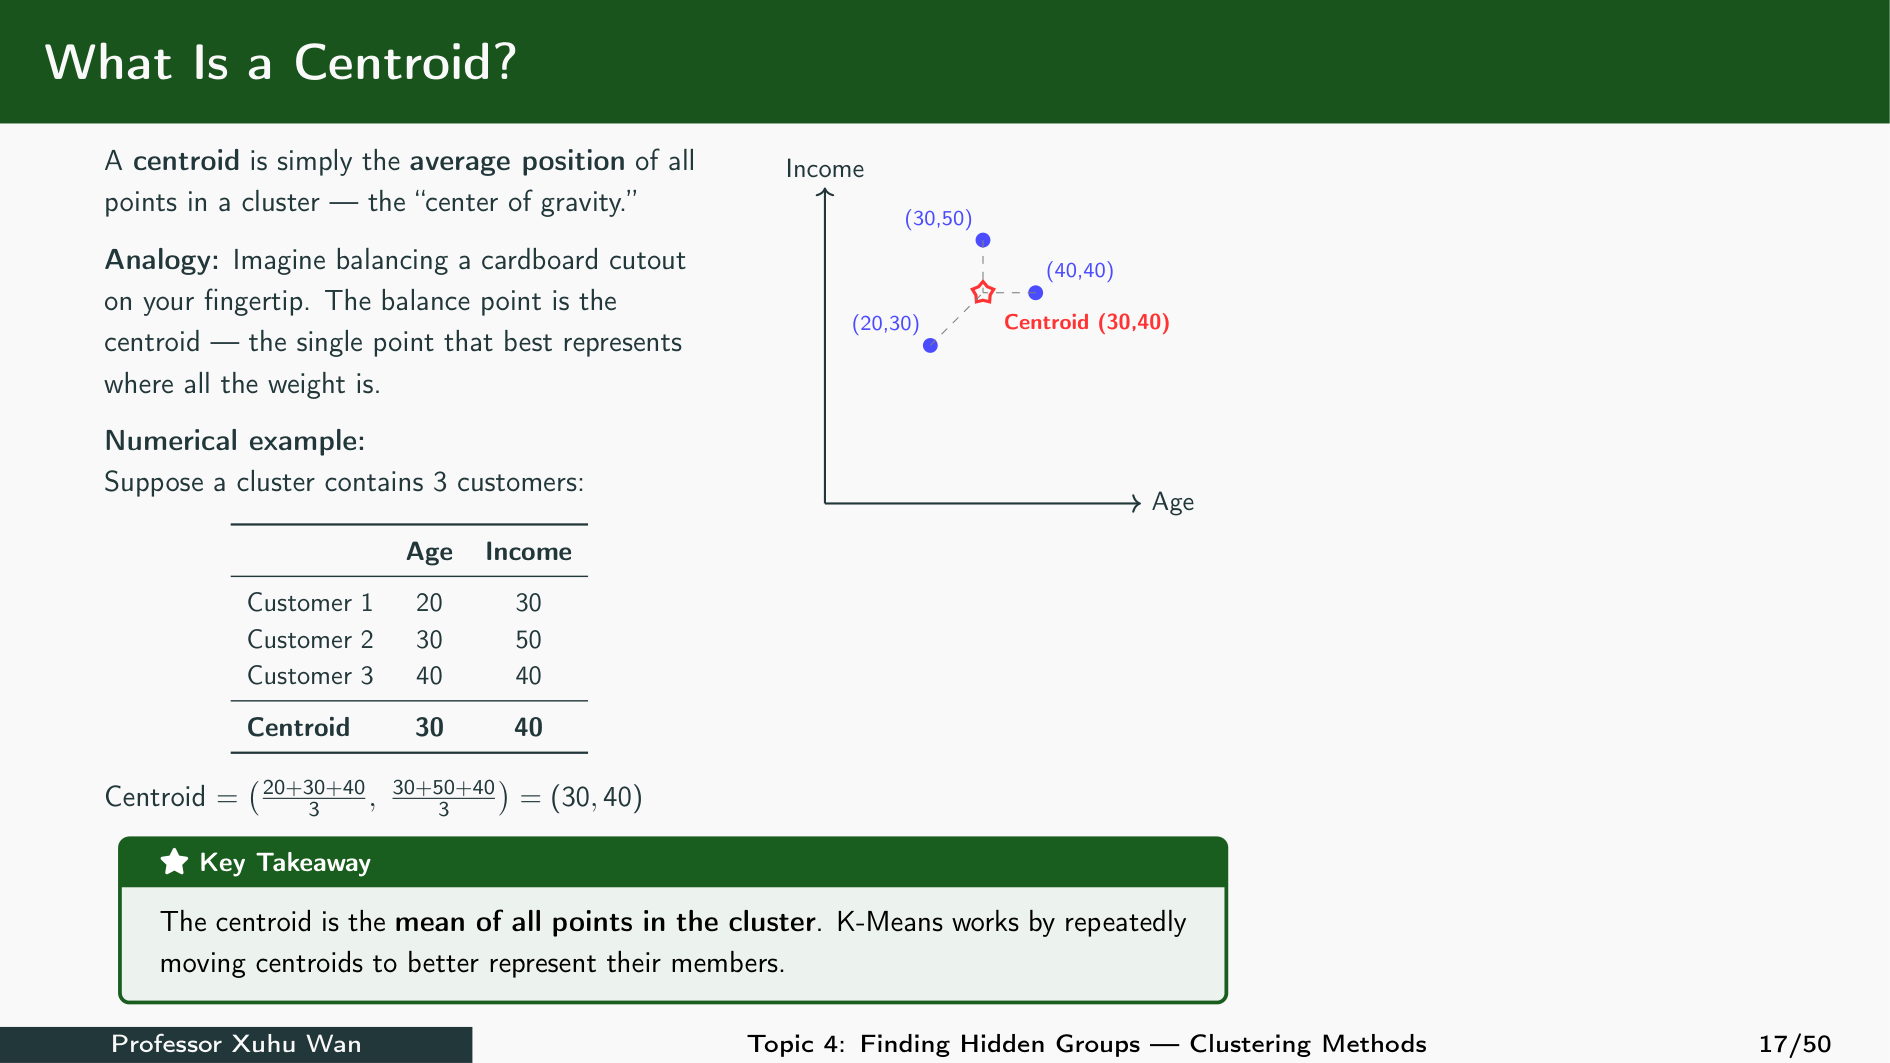
A Centroid Is a Coordinate-Wise Mean
For three points shown in prepared illustrative coordinates, (20,30), (30,50), and (40,40), the centroid is (30,40). It need not be an observed customer. A centroid is the coordinate-wise mean; Python clustering fits use standardised features.
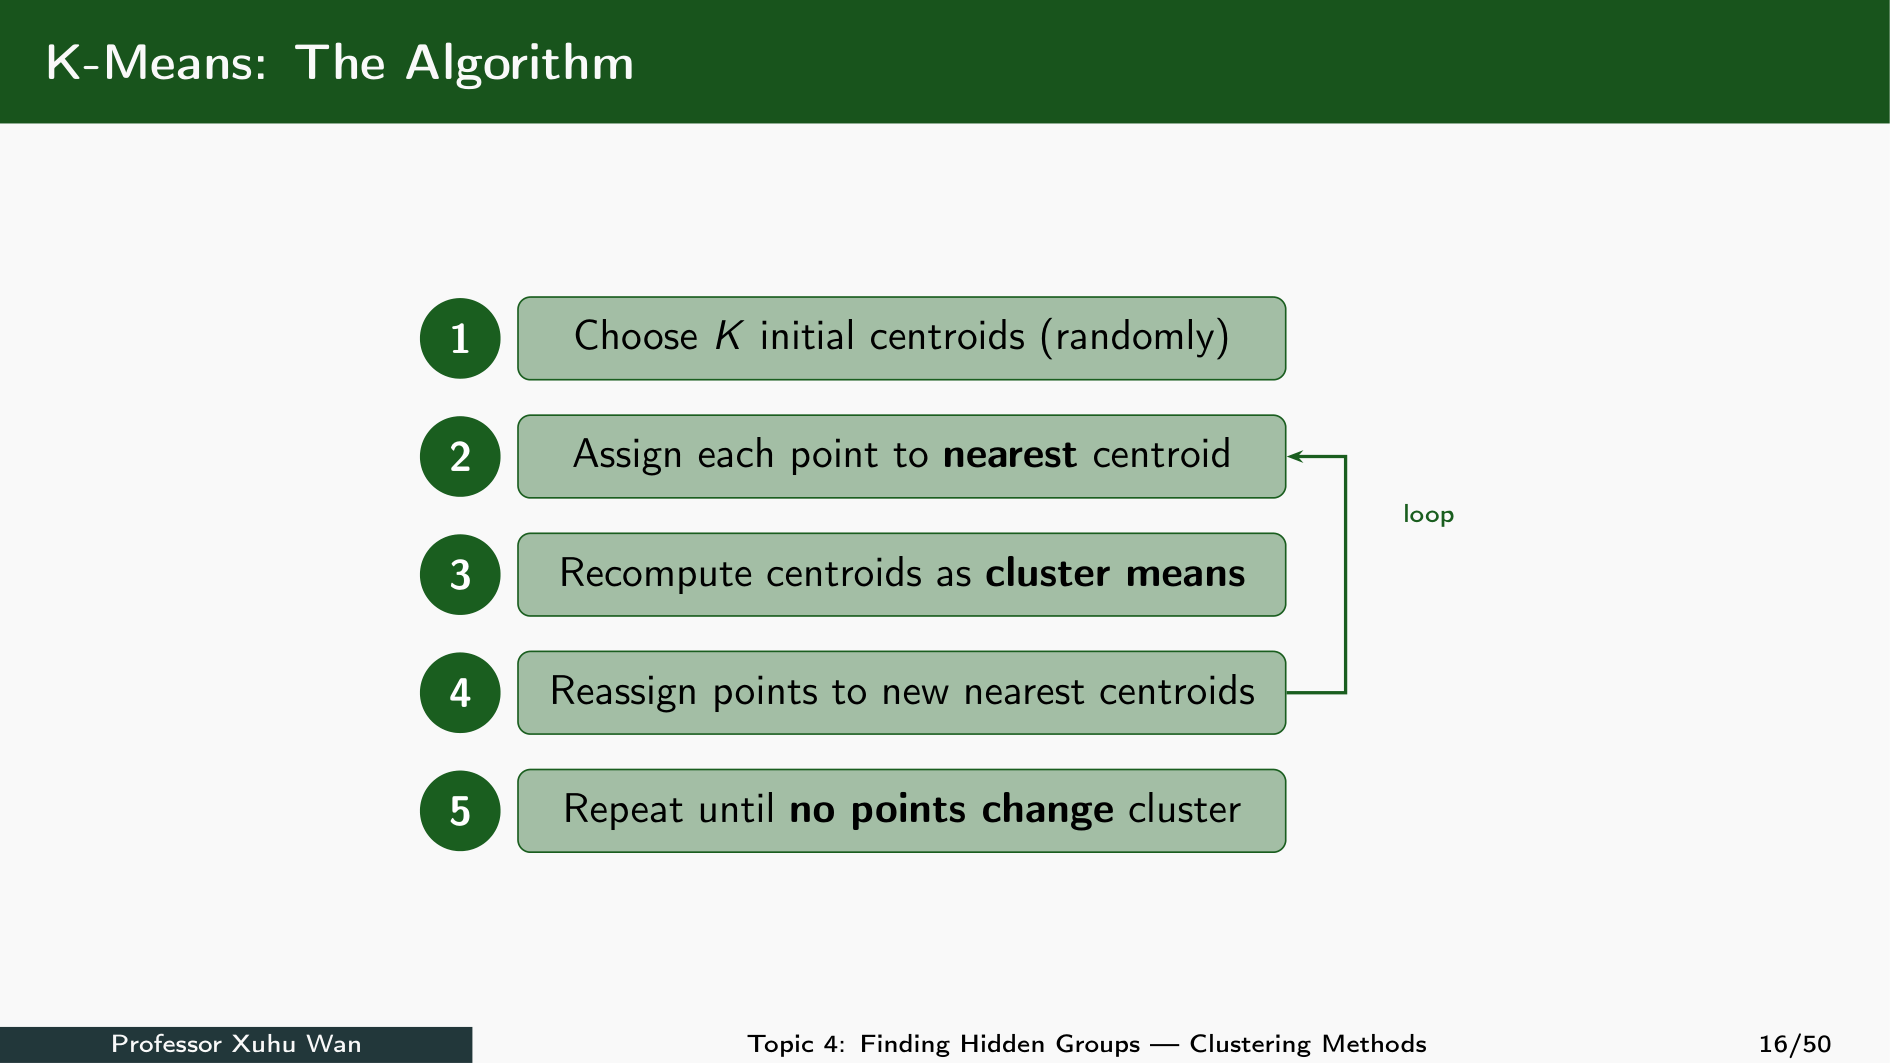
The K-Means Algorithm
The final centroids are not known at the start. To find a group mean, we need to know its members; to assign members, we need centres. K-means solves this by repeating two operations: assign customers → recompute group means.
This is an iterative algorithm: new centres lead to new assignments, which lead to new centres. Keep K fixed during one fit. Follow the loop in the original lecture diagram, then work through the four illustrated steps below.
Manual diagrams use prepared schematic coordinates to show the algorithm. Python model fits always standardise the input features first.
K-Means Step 1: Choose Initial Centroids
Choose K=2 first. Each dot is a customer with two features. Start with centre 0 at A=(1,1) and centre 1 at C=(2,1). The grey customers have not yet been assigned.
These are starting guesses, not the final group means. We deliberately start both centres in the lower-left cloud so we can see why repeated updating is necessary. The software can choose starting centres automatically; here we set them for illustration.
K-Means Step 2: Assign to the Nearest Centroid
Keep the centres fixed while assigning all customers. Compare each customer’s distance to both centres. Colour the customer according to the nearer centre.
The first assignment is A,B → group 0 and C,D,E,F → group 1. C is at centre 1, so its distance to that centre is zero.
Do not move a centre after assigning just one customer. Finish this assignment step first; then compute both group means.
K-Means Step 3: Recompute the Centroids
Keep memberships fixed and average each feature within each group. The hollow circles mark the old centres; arrows point to the new means. Customer dots stay where they are.
Moving a centre can change which centre is closest. With the updated centres, C is 1.118 from centre 0 and 6.374 from centre 1. C therefore switches from group 1 to group 0 (outlined in gold).
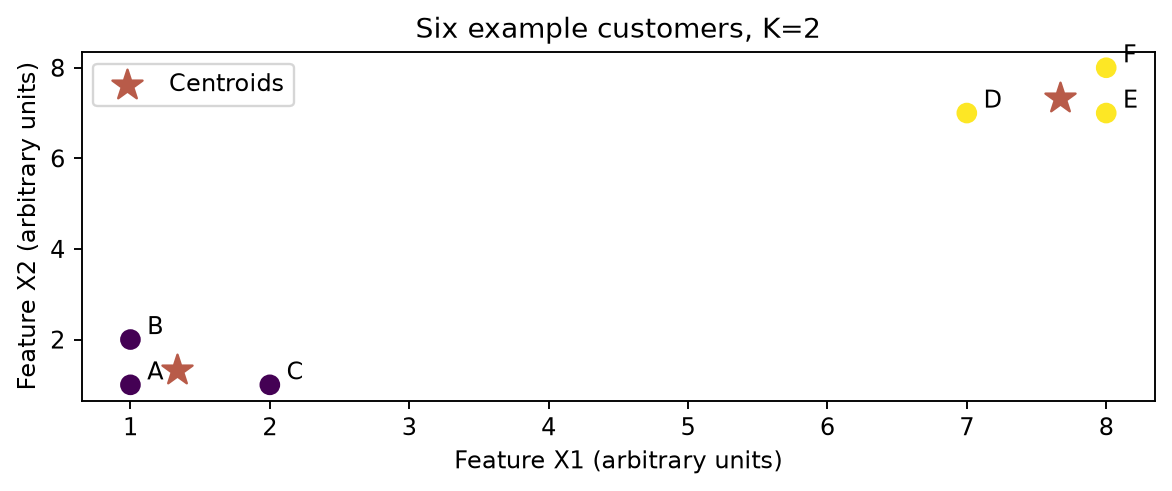
Compute the means again: A,B,C now give centre 0=(1.333,1.333); D,E,F give centre 1=(7.667,7.333). The centre update from Step 3 was not the final answer.
Check the assignments once more. Here nobody switches, so another mean calculation would give the same centres: stop. Other datasets may need more rounds.
For any assignment step, compare distances to every current centre. Use the same feature scales as the clustering fit. The point joins the nearest centre; cluster numbers only name groups.
The following Python calculation is a separate distance example with P=(2,1), centre 0=(1,1) and centre 1=(8,8). Squared distances are 1 and 85, so P joins group 0. Squaring preserves which nonnegative distance is smaller.
Compute One Assignment in Python
For point P=(2,1) and centres (1,1) and (8,8), squared distances are 1 and 85. argmin() gives the zero-based position of the smaller value, so P joins cluster 0.
Recompute Each Centre with .loc and .mean()
For this assignment, A/B/C form cluster 0 and D/E/F form cluster 1. Select each cluster separately with .loc, then use .mean() to calculate its coordinate means. Put the two mean rows in a DataFrame: these are the updated centres.
Interactive K-Means: Assign and Update
Press Play stages to watch initial centres → assignments → mean updates → stable assignments. Pause to explain a stage, use Next step to advance manually, or Reset steps to replay. Start with two centres in the same cloud. Watch customer C switch groups after the first update; update again, then check that assignments stay stable.
Fit KMeans in Python
First standardise X1 and X2 with StandardScaler. Create an estimator with K=2, a fixed random seed, and 10 initialisations. .fit_predict(X) fits the model to those standardised coordinates and returns one label per customer. The printed centres are also in standard-deviation units.
KMeans Attributes and Methods
Fitted attributes:.labels_, .cluster_centers_, .inertia_, .n_iter_. Methods:.fit(X), .fit_predict(X), .predict(new_X). Cluster IDs start at 0 in KMeans and are arbitrary labels, not ranks.
Render Fitted Groups and Centres
The model is fitted on standardised features. For this plot, scaler.inverse_transform(...) converts its centres back to the original X1/X2 coordinates, so stars and customer points use the same axes. Colour represents membership, not quality or profitability.
Assign a New Record
.predict() assigns a new point to a fitted centre; it does not update the centres. Transform the new record using the same fitted scaler before prediction. Do not fit a new scaler to it.
In-Class Practice: Explain the Object
Print the shape of .cluster_centers_, count members per cluster, and assign (7.5,7.5) after transforming it with the fitted scaler. Explain which operation would retrain the centres.